Gasolytics
I built a fuel-price map and comparison toolkit around published price snapshots.
- My role
- Independent developer
- Context
- Independent product · Maps and data delivery · 2026
Next.js · React 19 · TypeScript · d3-geo · Vercel Blob · Vercel
- Problem
- Visitors need to move from a national price map to state details or a trip estimate.
- Decision
- Project map geometry on the server and keep source data dates distinct from read times.
- Verified behavior
- Local fixtures confirmed stale-cache fallback and an explicit error when a fresh process had no usable data.
Connect the map to a useful question
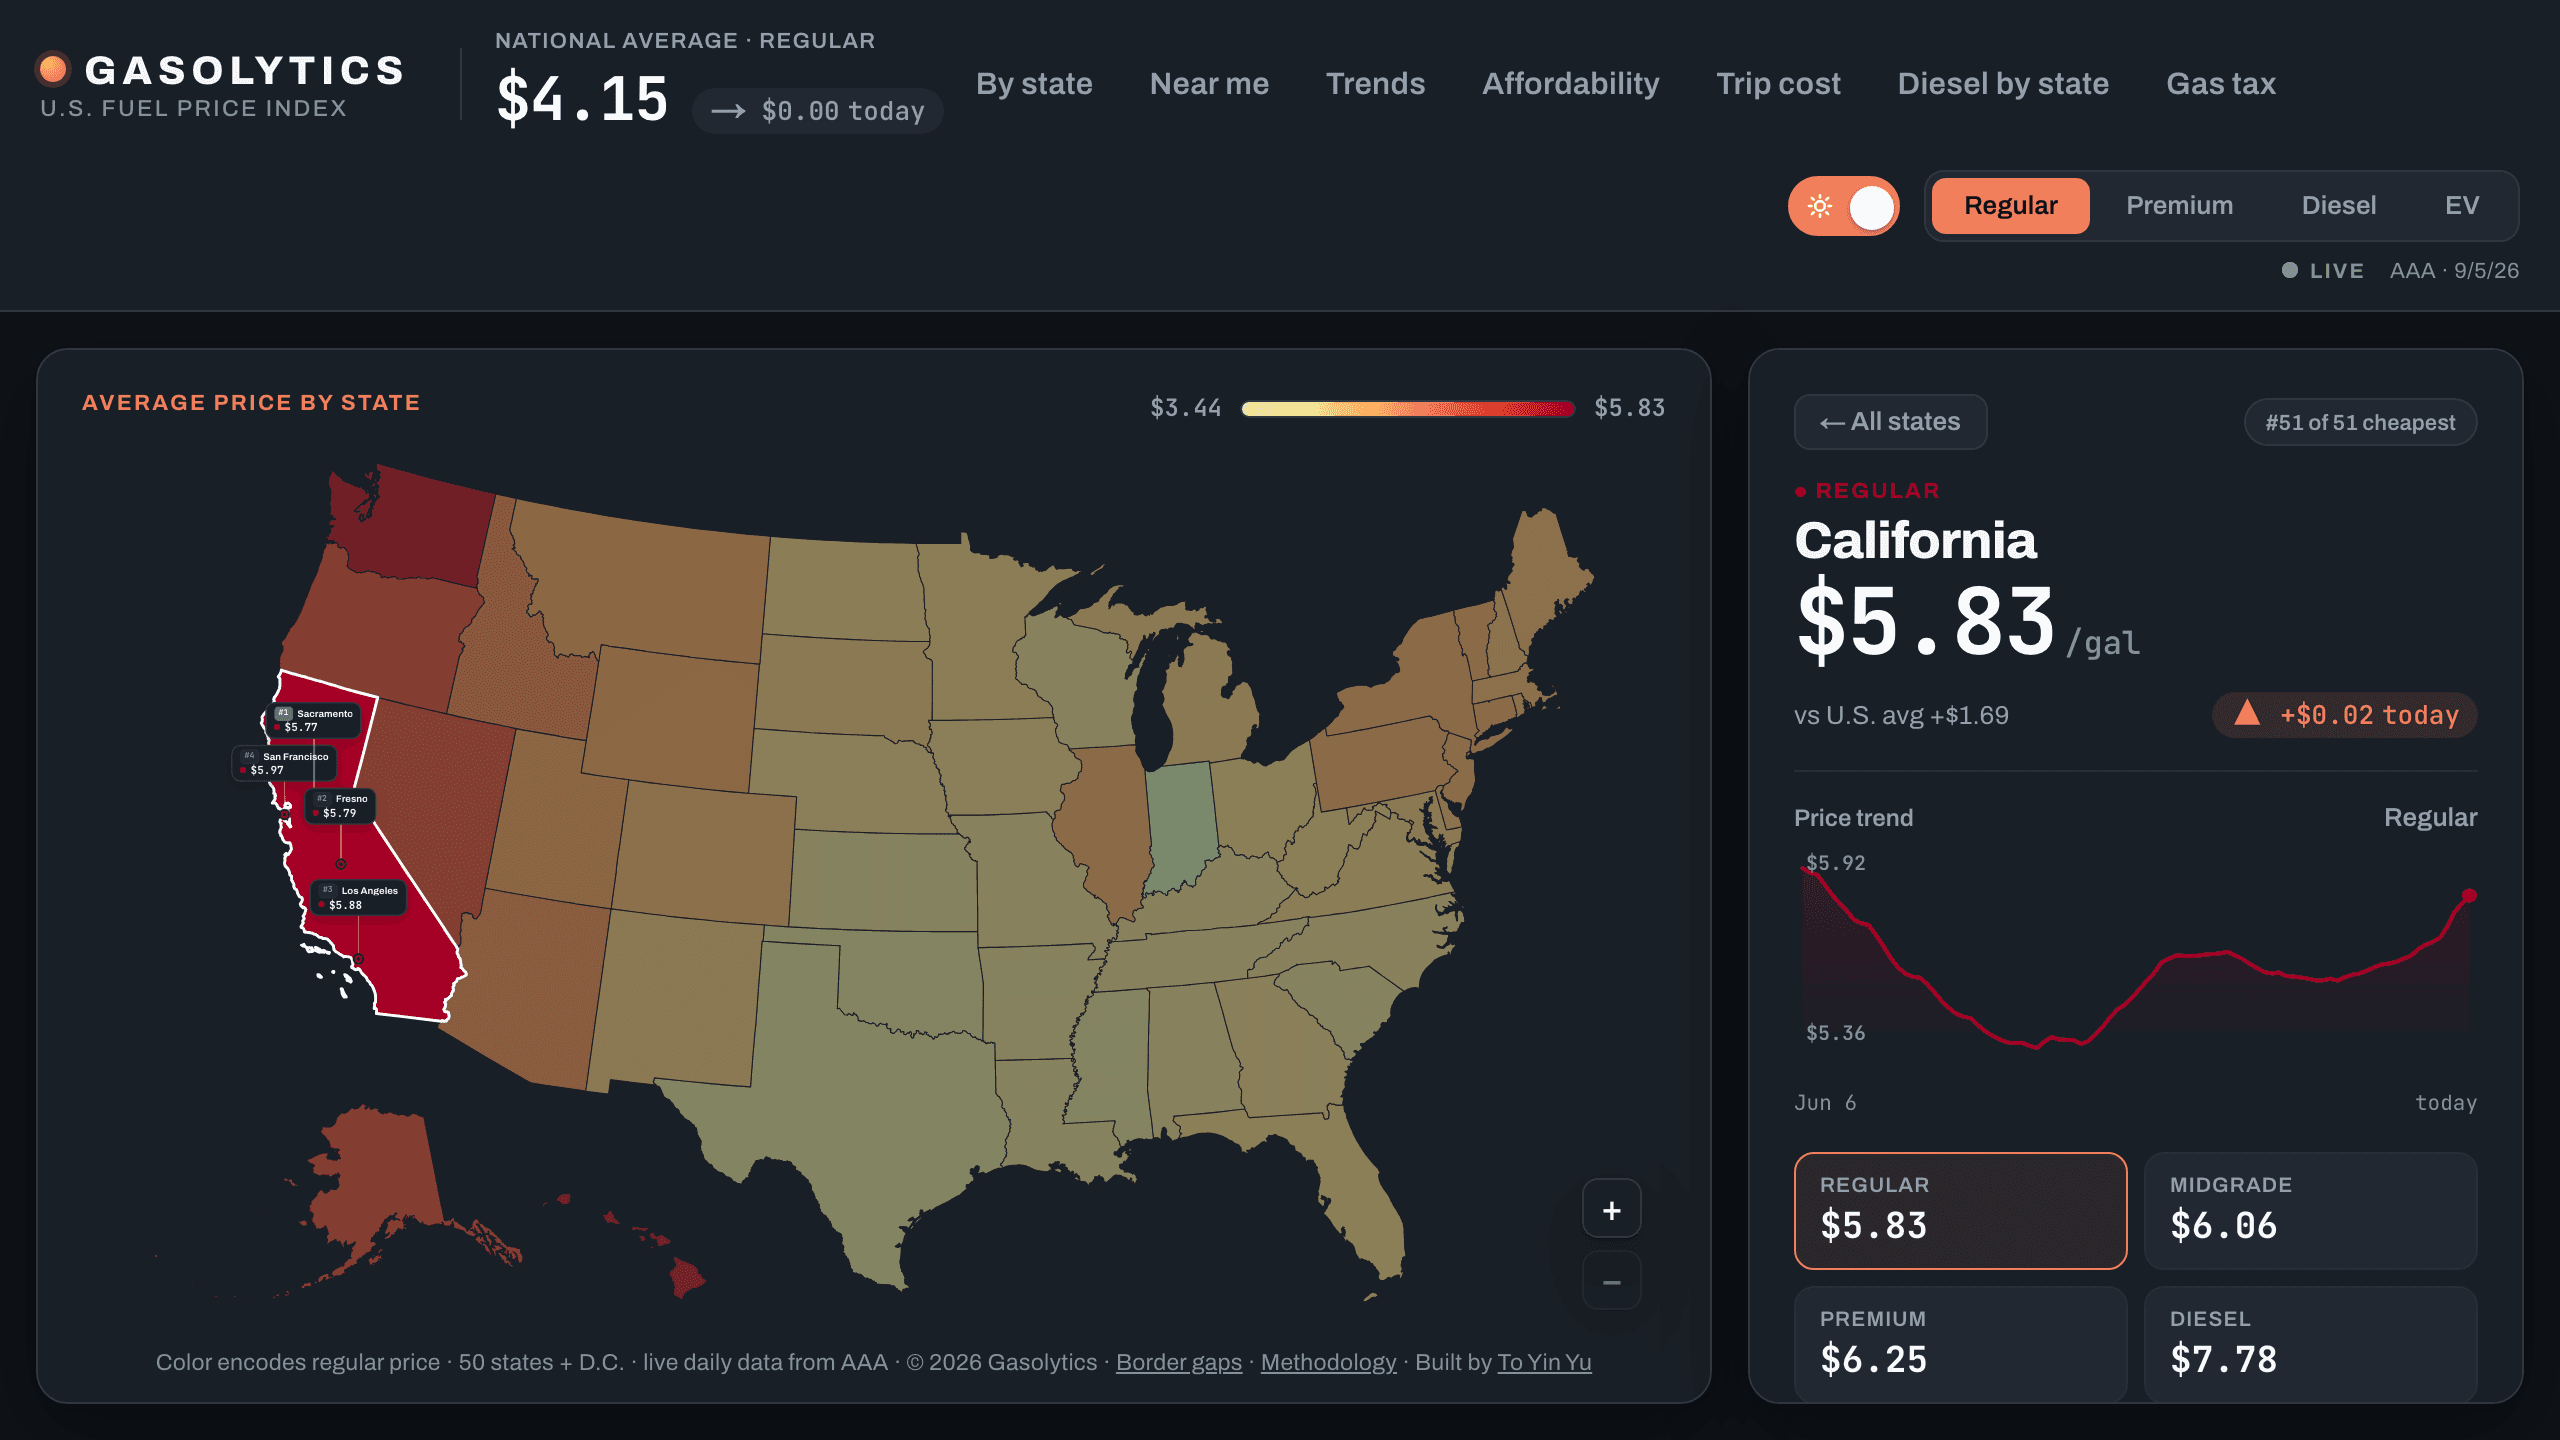
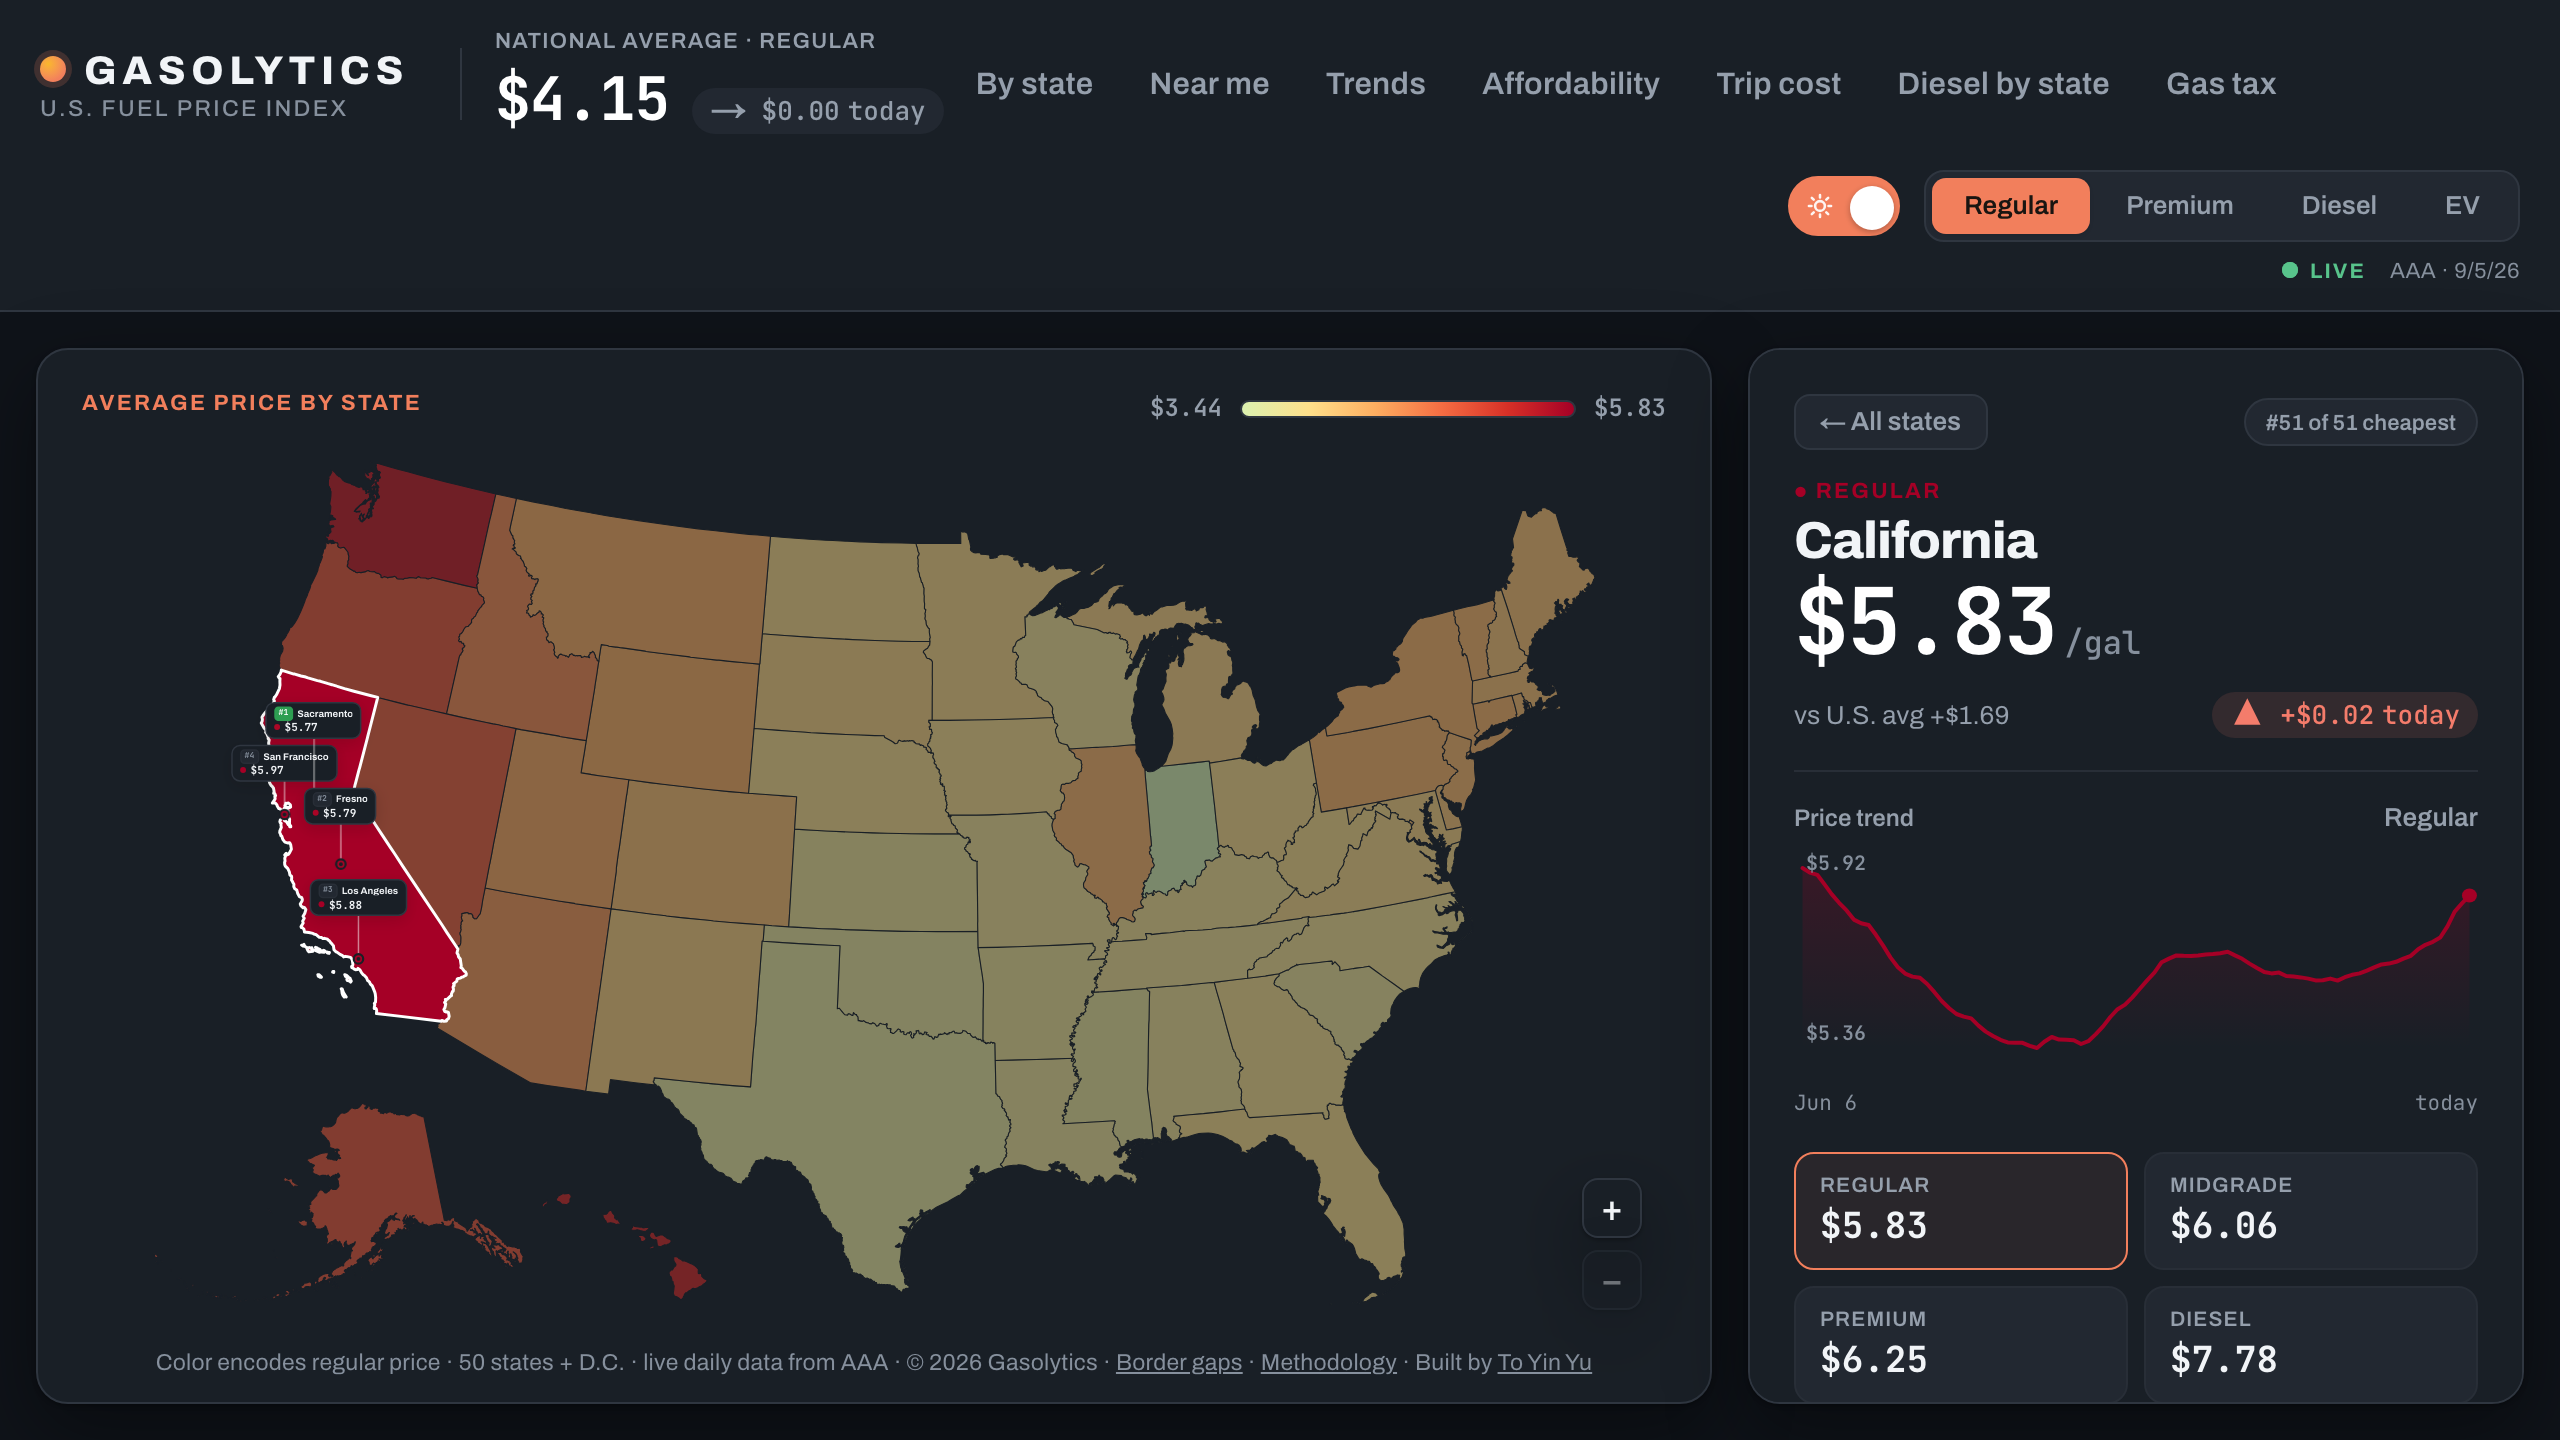
A national map gives a quick comparison, but a visitor may want to inspect one state or estimate fuel for a trip. Gasolytics connects the overview to state and metro details, price history, a trip calculator, and EV comparisons. The map’s selected state opens a panel with the corresponding prices and trend instead of sending the reader through a separate search.
The capture shows California selected with a visible snapshot date. The panel connects its map position to prices and history, so a reader can move from a national pattern to a specific place. State and metro averages describe an area, rather than individual station quotes.
Project the geometry on the server
The server uses d3-geo to turn geographic shapes into SVG path strings. The browser receives those shapes and handles the interactive layer: selection, zoom, pan, and metro pins. This keeps map projection separate from the changing price data and from the event-handling code.
Changing a fuel grade updates the displayed prices without rebuilding the geographic projection in the browser. The geometry is imported as a traced asset instead of read from an assumed runtime file location, so the serverless deployment includes the shapes it needs. The tradeoff is sending rendered paths with the page rather than making the browser compute them.
Keep the snapshot date distinct
The separate Databank project publishes AAA snapshots; Gasolytics reads them from Vercel Blob. It does not perform the upstream scraping in the request path. The application shapes the snapshots for its views and uses a short-lived, in-process cache so repeated reads can reuse a result.
The response carries both the source data date and the time it was read. Those have different meanings: a page can be rendered now from an older snapshot. The current cache lasts up to 30 minutes within a process, while page revalidation and the upstream publication schedule are separate concerns. A recent request alone does not prove fresh source data.
Explain both estimates and unavailable data
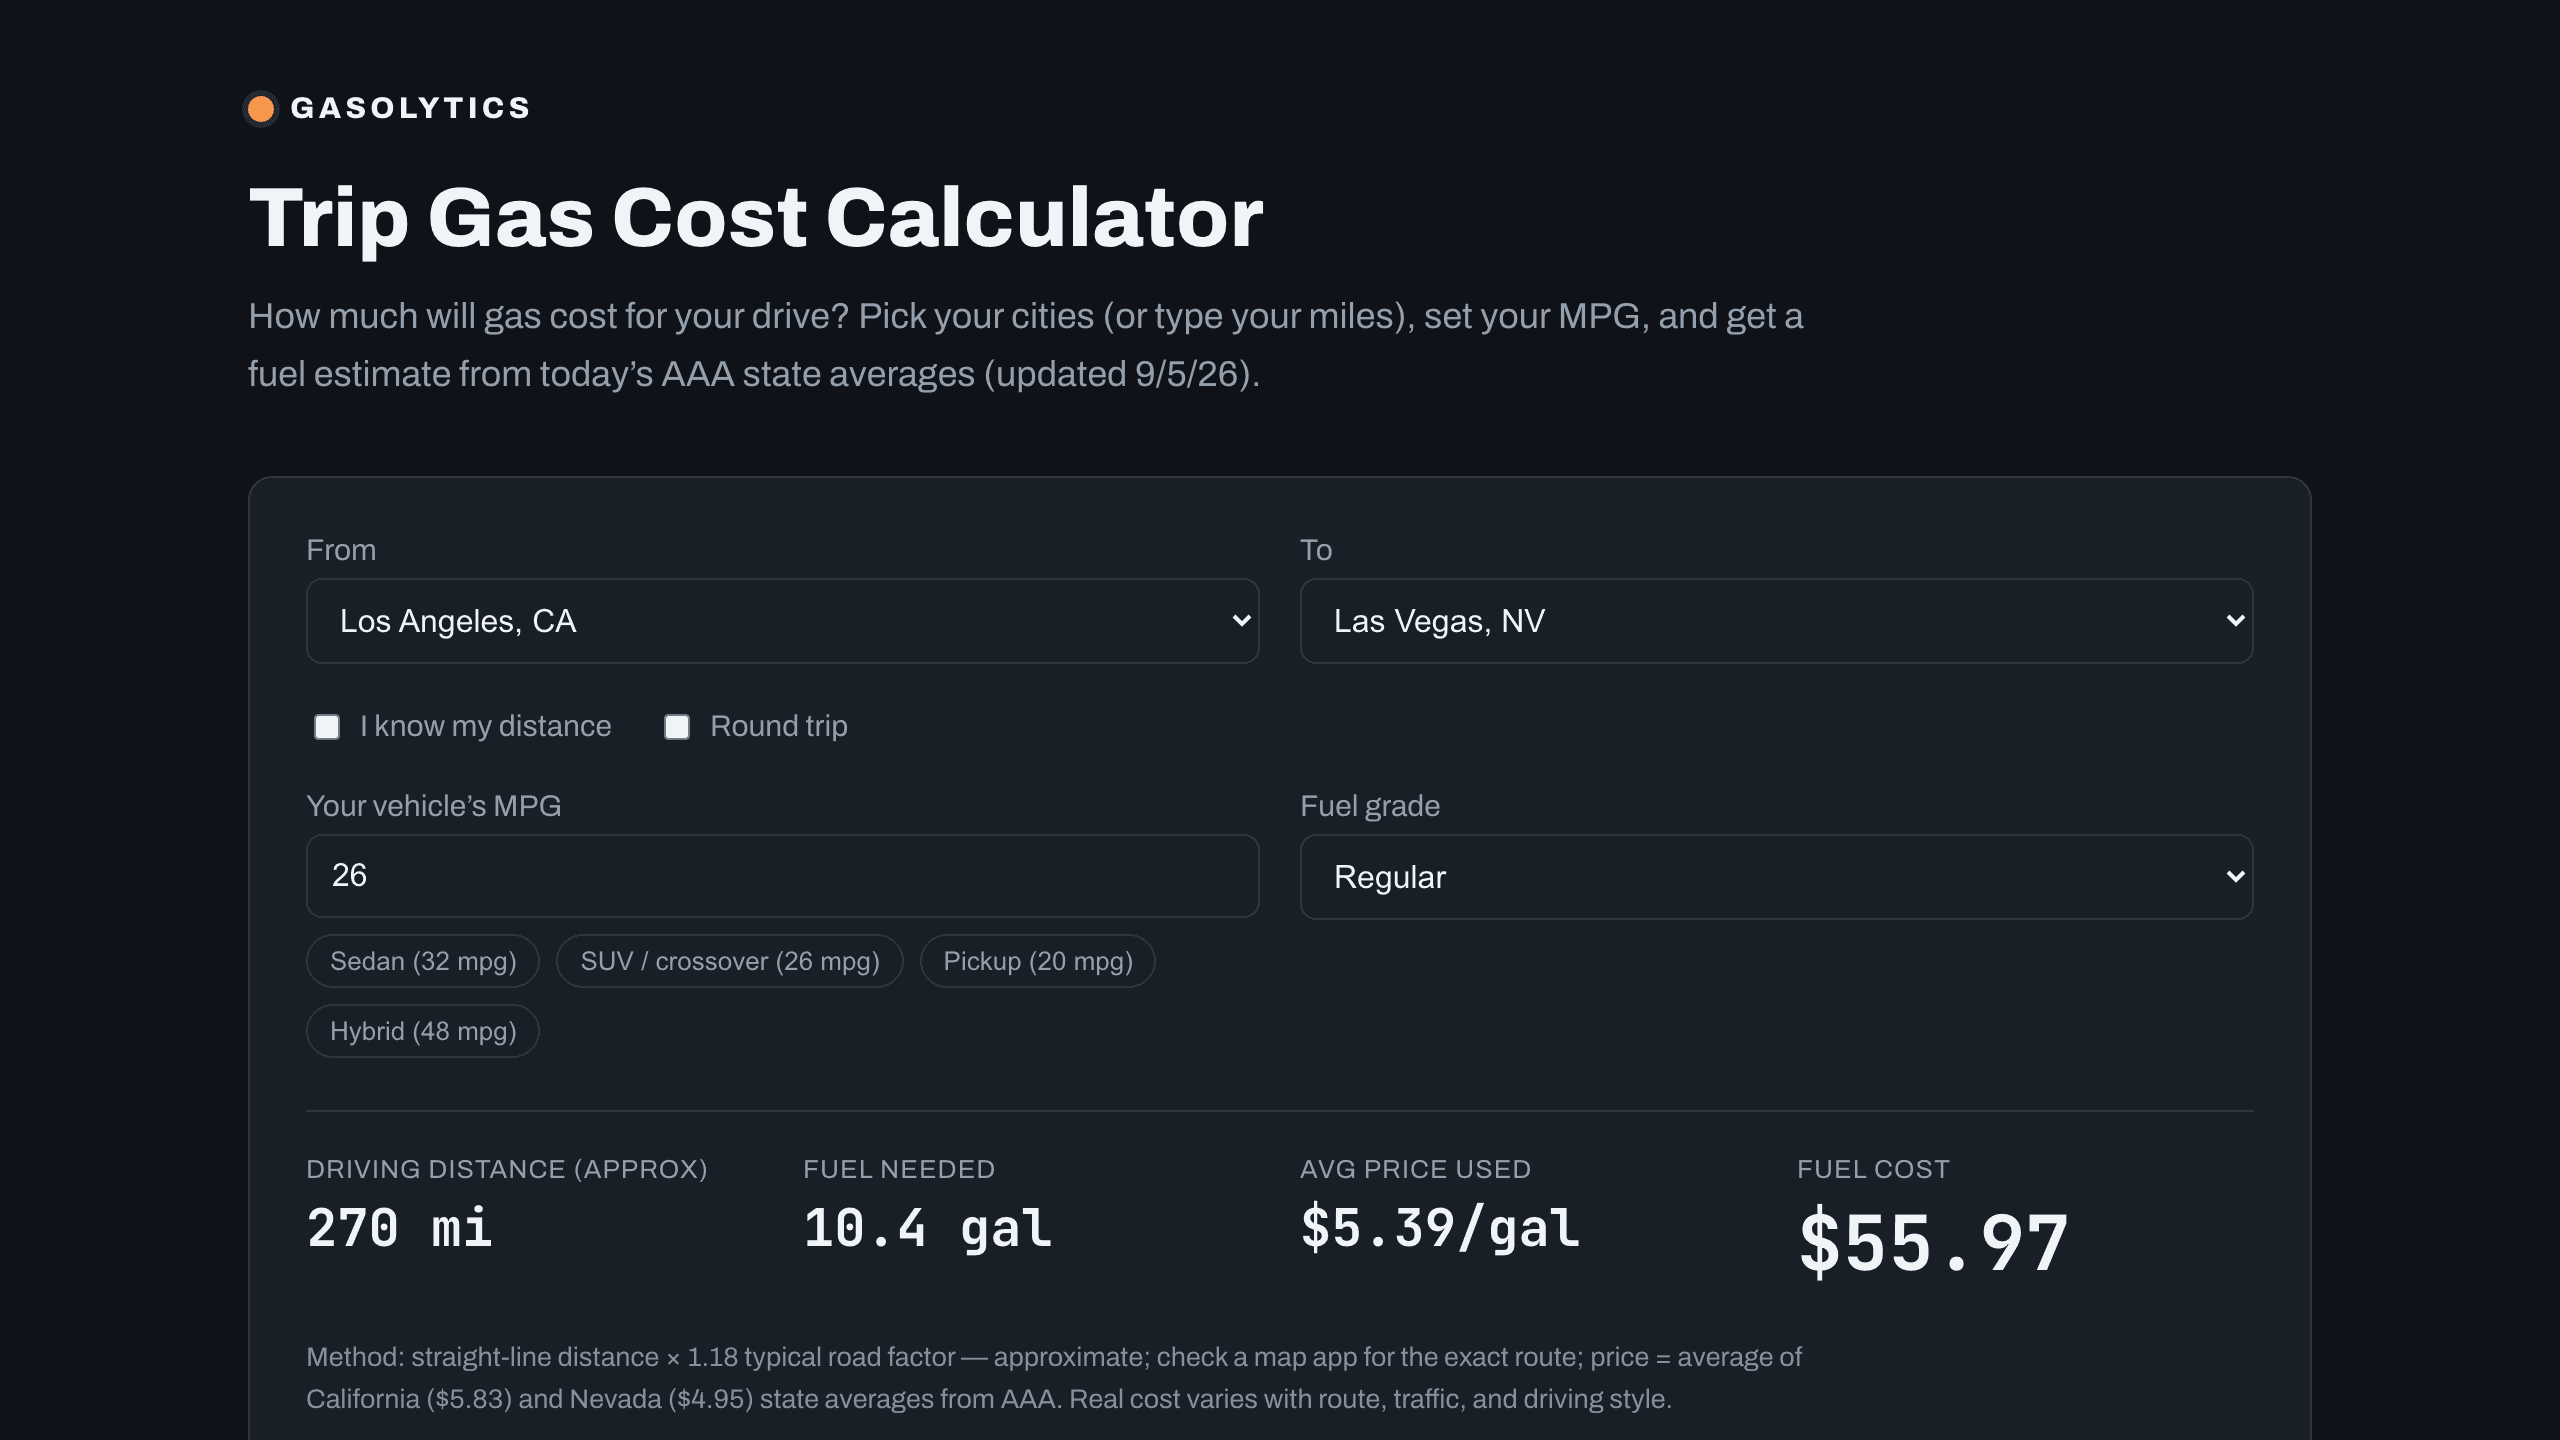
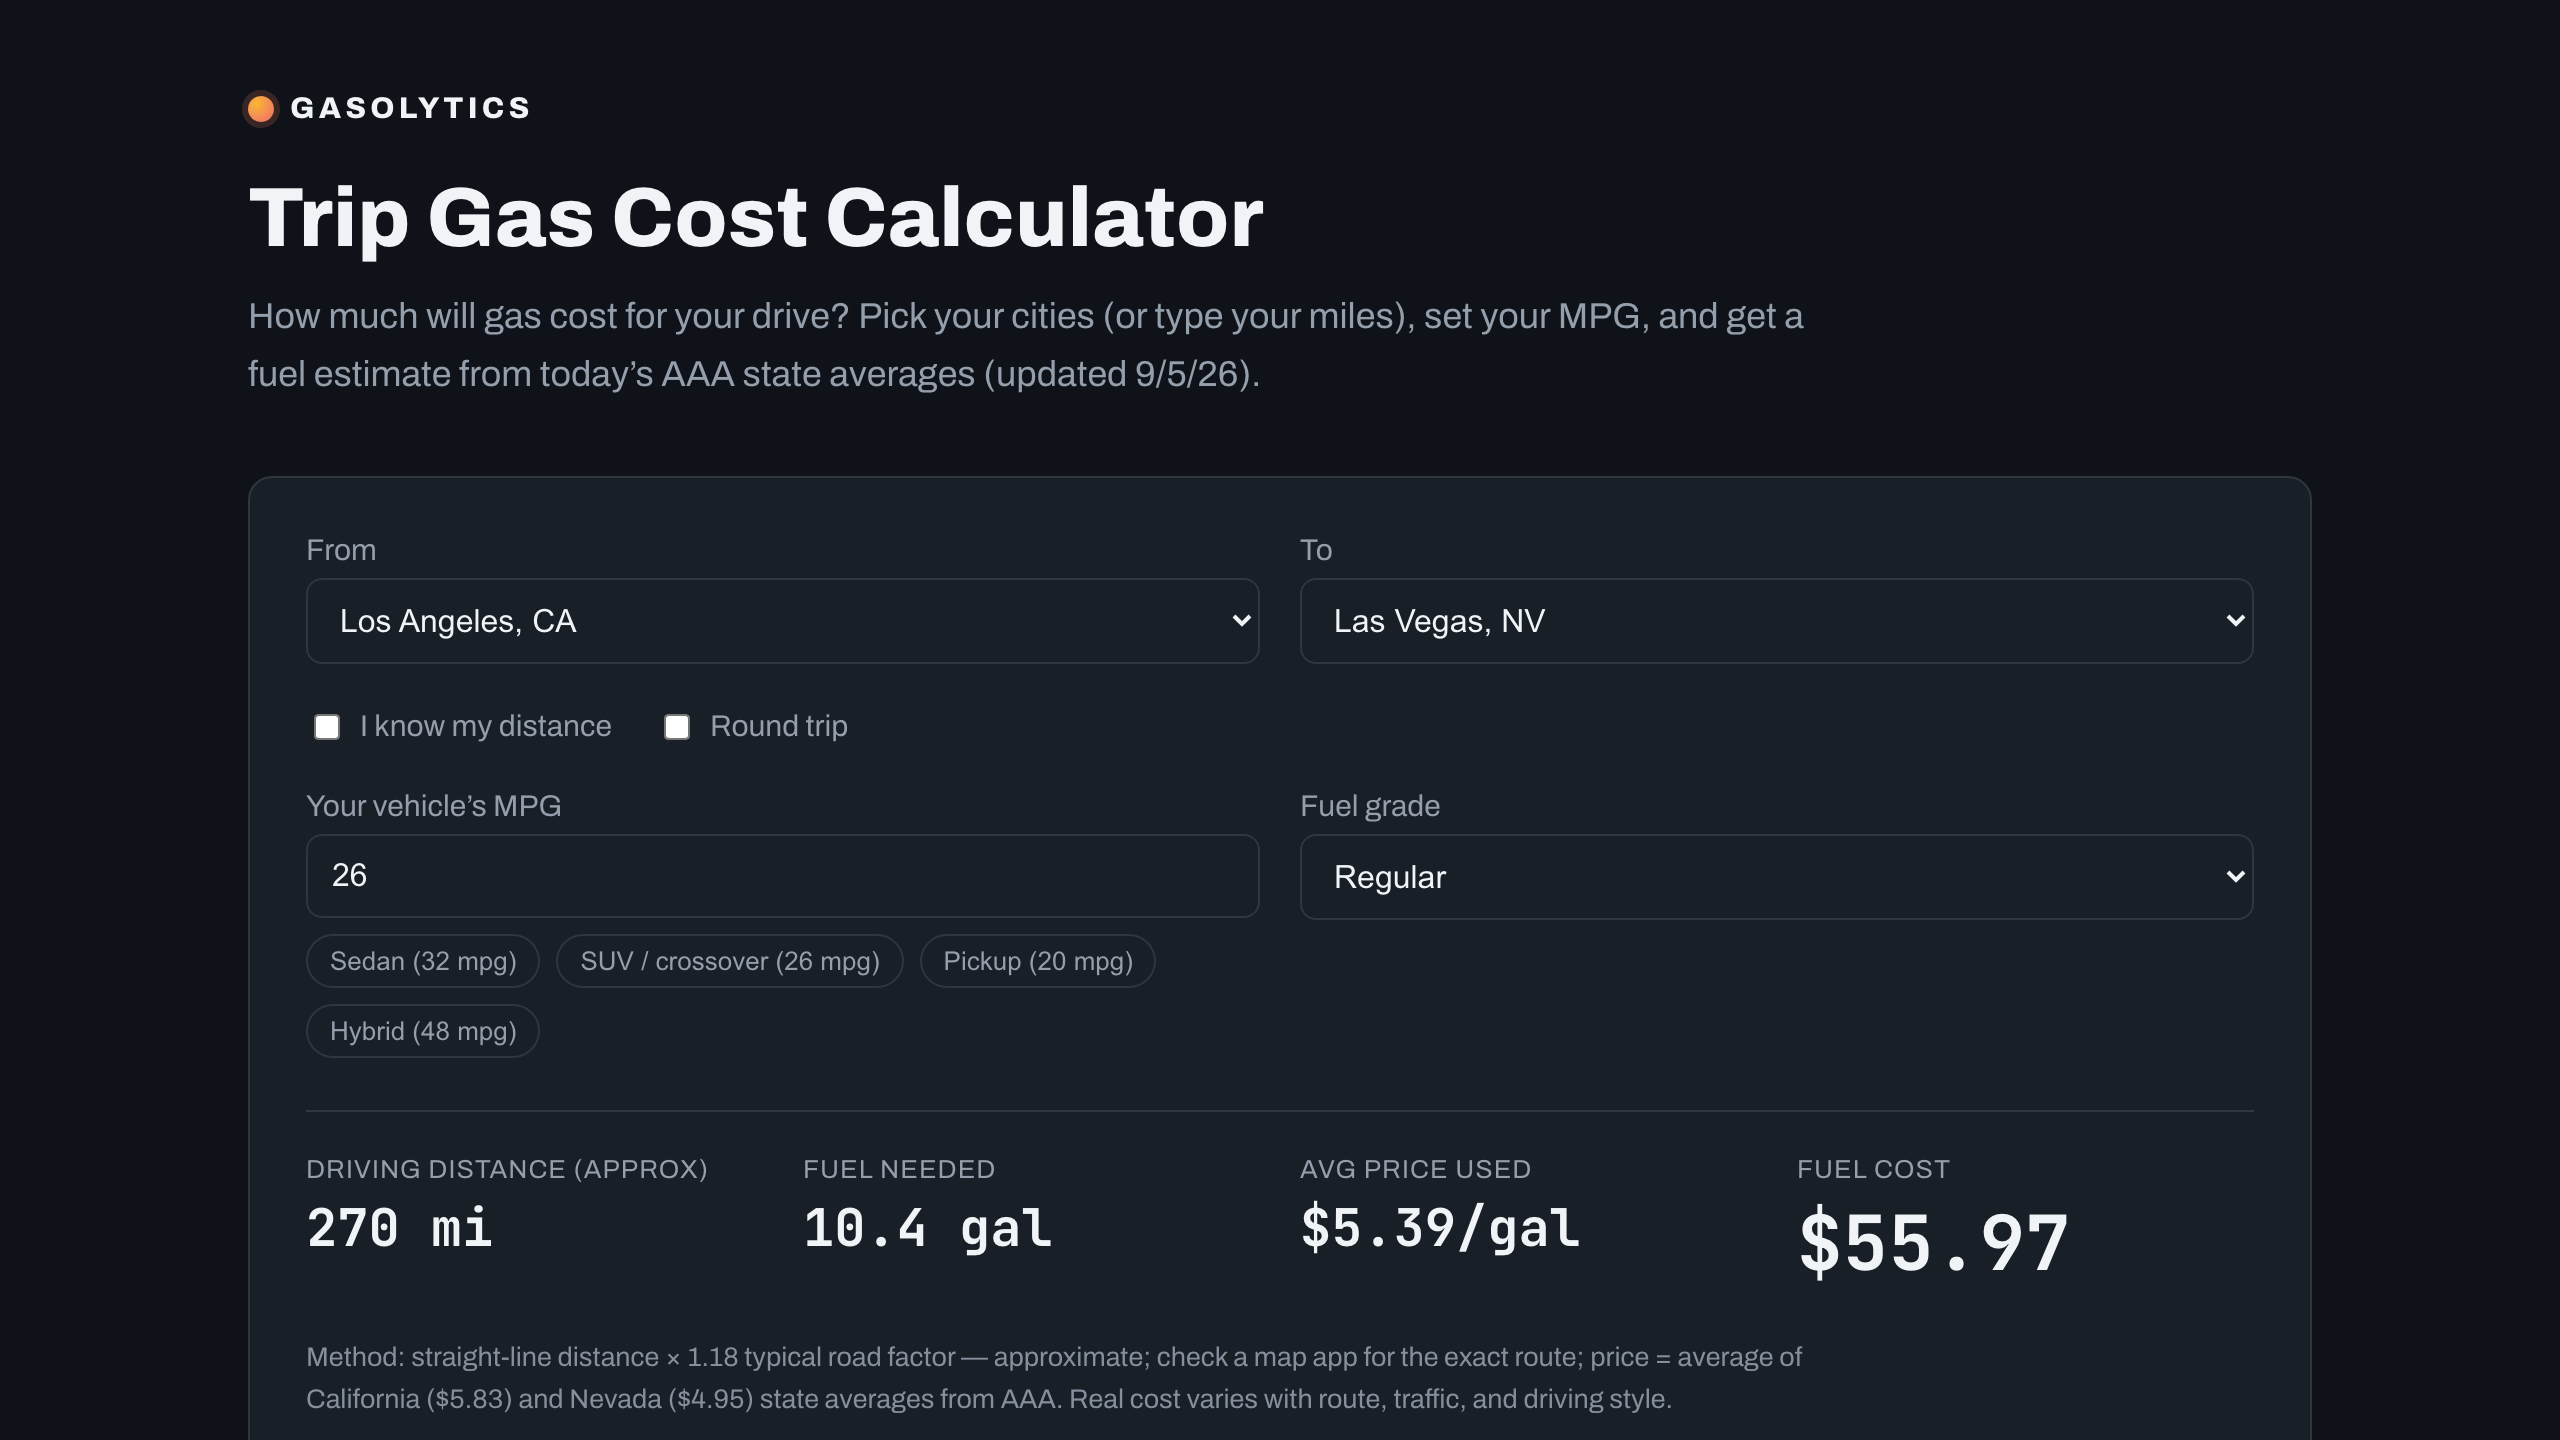
The trip calculator exposes the assumptions behind its result: distance, fuel economy, selected fuel grade, and the state averages used for price. Visitors can enter their own distance instead of relying on the approximate city-to-city distance. The result is a planning estimate, with the method beside it, rather than an unexplained dollar amount.
Unavailable data needs a separate response. I tested the data reader against local synthetic snapshots with network access disabled. A successful read populated the cache; an expired cache followed by an unreadable input returned the previous result marked stale. A fresh process without usable data raised an explicit error instead of returning an invented price.
What this demonstrates and what comes next
The work connects a published data artifact to an interactive comparison: read and shape the data, render stable geometry, expose useful detail, and explain the estimate. The local checks establish the tested cache and failure behaviors, while the public interface makes the underlying date and calculation inputs visible.
The next improvement I would validate is how clearly readers distinguish fresh, cached, and unavailable data across every view. The same status should mean the same thing on the map, detail pages, and calculators, with the actual source date available wherever it affects a decision.
Public map and calculator captured read-only on September 5, 2026. Cache and failure checks used isolated local fixtures with network access disabled.